
How to Break 90 in Golf: What the Score Data Actually Requires
Shot Scope's per-hole averages put a 15 handicap at 89.5 and a 20 handicap at 94. The 4.5-stroke gap lives on par 4s, and double bogeys decide it.

Quick answer
Breaking 90 is a bad-hole problem. Shot Scope’s per-hole-type averages put a 15 handicap at 89.5 and a 20 handicap at 94.0 on a standard par 72, and 2.6 of that 4.5-stroke gap sits on par 4s. The events behind it are penalty strokes, sideways recovery shots and three-putts — an average 15 handicap already makes 4.2 doubles or worse against 0.5 birdies per round.
The three milestones at a glance
| Milestone | Share of golfers | Index that plays to it | Typical hole profile | Dominant leak |
|---|---|---|---|---|
| Break 100 | ~52% | ~28 | 6-7 doubles or worse | Penalties and lost balls |
| Break 90 | ~25% | ~18 (12-15 to do it often) | 4 doubles, 9 bogeys, 5 pars | Doubles, three-putts, failed chips |
| Break 80 | ~5% | ~8 | 1-2 doubles, 2 birdies | Approach play from outside 100 yards |
Share-of-golfers figures come from Golf Digest’s score distribution — roughly 5 percent in the 70s, 20 percent in the 80s, 27 percent in the 90s. It is an older estimate of how rounds land rather than a survey of who has broken each number once, and no current USGA or National Golf Foundation study measures the latter. The Index column is the differential arithmetic, covered next.
What breaking 90 actually requires
A score of 90 on a course rated 72.0 with a Slope of 113 produces a Score Differential of exactly 18.0, because the formula reduces to (113 ÷ 113) × (90 − 72). So an 18 Handicap Index is the player for whom 90 is a good round.
Shooting it regularly is a different number. The USGA’s probability table shows a golfer between 15.0 and 19.9 produces a differential at or better than their Index roughly once every 5.1 rounds. An Index describes demonstrated potential, and most rounds land 2 to 5 strokes above it by design — the mechanics are in Golf Handicap Explained. Breaking 90 in most rounds rather than one in five means carrying an Index closer to 12 to 15.
For scale: the USGA’s 2025 Golf Scorecard reported an average Handicap Index of 14.0 for men and 28.8 for women across about 3.68 million golfers with an Index. The average male golfer with a handicap is already, on paper, a golfer who breaks 90 on a good day.
The anatomy of an 89: how many pars, bogeys and doubles
Work backwards from the number. An 89 on a par 72 is 17 over. With no birdies, three combinations of hole scores get there, and all of them are ordinary:
| Pars | Bogeys | Doubles | Total over par |
|---|---|---|---|
| 6 | 7 | 5 | 17 |
| 5 | 9 | 4 | 17 |
| 4 | 11 | 3 | 17 |
Every bad hole in that table is a clean double. A single triple pushes the round to 90, which is the whole argument of the next two sections.
Nine bogeys and five pars describes a round with four bad holes instead of six. Ball-striking barely enters it.
Arccos’s published hole-score distribution says the average 15 handicap is already close to that card: 0.5 birdies, 5.3 pars, 8.4 bogeys and 4.2 doubles or worse. A 5 handicap in the same dataset posts 1.2 birdies, 8.9 pars, 6.4 bogeys and 1.6 doubles or worse. Each figure is an independently rounded average, so the four categories sum slightly past 18 holes.
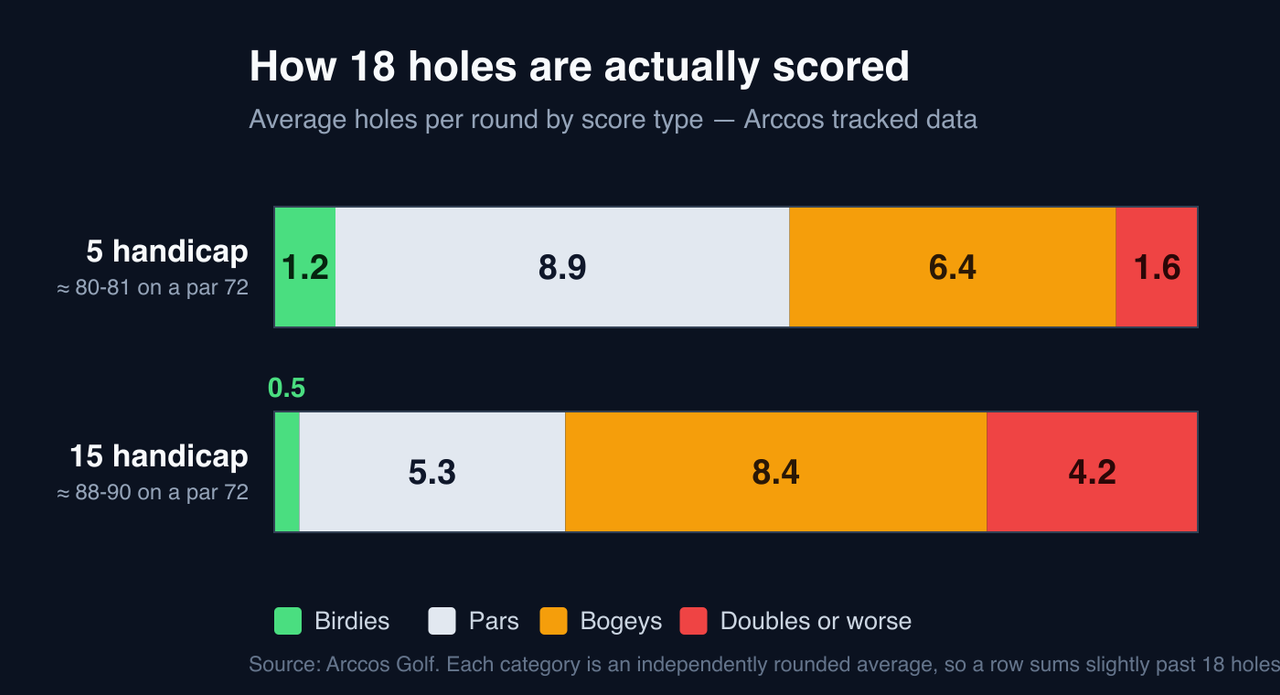
Severity does more work here than frequency. Those 4.2 holes sit in one category on the chart, and the category spans everything from a double to a snowman. If each averages exactly 2 over, the 15 handicap’s card totals 16.3 over — an 88.3. If they average 2.5 over, the same distribution totals 18.4 — a 90.4. The identical hole count lands on either side of the milestone depending only on how bad the bad holes get.
For a golfer stuck in the low 90s, the first target is depth: cap the bad holes at a double. That requires no new swing.
Where the strokes between 94 and 89 live
Shot Scope publishes average score by hole type for each handicap band. Multiply those out across a standard par 72 of four par 3s, ten par 4s and four par 5s:
| Hole type | 15 handicap | 20 handicap | Holes | Difference |
|---|---|---|---|---|
| Par 3 | 3.83 | 4.00 | 4 | 0.68 |
| Par 4 | 5.05 | 5.31 | 10 | 2.60 |
| Par 5 | 5.91 | 6.23 | 4 | 1.28 |
| Round | 89.5 | 94.0 | 18 | 4.56 |
Sources: Shot Scope’s 15-handicap benchmarks and 20-handicap benchmarks.
The totals land almost exactly on the two sides of the milestone — 89.5 and 94.0 — which is a useful accident. It means the published gap between a 20 and a 15 handicap is the break-90 problem, and it can be located. Ten par 4s carry 57 percent of it. Par 3s carry 15 percent.
That rules out a few popular explanations. Driving distance separates the two bands by about 14 yards on Shot Scope’s filtered average, 239 against 225, which is worth a club on approach and very little else. The par-4 difference of 0.26 strokes per hole is a quarter of a stroke — roughly one extra bad hole every four par 4s.
The three leaks that decide the round
Penalty strokes and recovery shots
Lou Stagner’s Arccos analysis compared each player’s best 20 percent of rounds against their worst 20 percent, using players with at least 40 rounds logged in 2022. For a 15 Index, the bad rounds carried 1.22 more penalty strokes and 1.22 more recovery situations, while fairways hit differed by less than one across all skill levels.
The figure describes a within-player spread rather than a per-round average. The gap between one golfer’s good rounds and their own bad rounds comes to roughly 2.44 additional penalty and recovery events, with fairway count barely moving. A missed fairway into rough costs a fraction of a stroke. A missed fairway into a hazard or behind a tree costs one to two, plus the compounding second mistake that usually follows.
The practical version: on the two or three holes per round where a penalty is reachable, the tee club is a decision rather than a habit. Everywhere else, Shot Scope’s tee data still favours the driver — an average par 4 played 4.81 after a driver against 5.11 after a 3-wood. Downgrading the club on every hole trades one problem for a slower one.
Three-putts
Shot Scope has a 15 handicap three-putting once every 9.7 holes — about 1.86 per round — against once every 7.6 holes for a 25 handicap. Arccos, which counts and filters differently, puts golfers over 15 at 19.58 percent of greens, closer to 3.2 per round. The platforms disagree; the direction does not.
Where they start matters more than the rate. Shot Scope reports that 83 percent of all three-putts begin from beyond 32 feet, and when a typical 15 handicap does three-putt, the first putt leaves an average of 8 feet for the second. Both halves of that point at speed control. The drills that address it are in Lag Putting Drills, and the strokes-gained accounting behind them is in Strokes Gained: Putting.
Failed up-and-downs
A 15 handicap gets up and down 35 percent of the time; a 20 handicap manages 32 percent, against 54 percent for a scratch golfer. Since a 15 handicap hits about 4 greens a round, this is 14 attempts, and roughly 9 failures.
One measured change moves it more than technique work does. Shot Scope found that 15 handicaps using an 8-iron, 9-iron or pitching wedge around the green instead of a gap, sand or lob wedge produced 8 percentage points more up-and-downs, proximity 6 feet closer, and a leave inside 6 feet almost a third of the time. The selection framework — when the ground shot is available and when it is not — is in Chipping vs Pitching.
Why breaking 80 is a different project
Mark Broadie, whose Golfmetrics amateur dataset produced Strokes Gained and Every Shot Counts, has decomposed the 10-stroke gap between a 90-shooter and an 80-shooter in public:
| Category | Strokes of the 10 | Share |
|---|---|---|
| Approach (outside 100 yards) | ~4.0 | ~40% |
| Driving | ~2.0-2.5 | ~20-25% |
| Short game | ~2.0-2.5 | ~20-25% |
| Putting | ~1.5 | ~15% |
| Driving + approach | ~6.5 | ~65% |
Every figure is approximate, which is why the rows span 9.5 to 10.5 rather than summing cleanly to 10. Broadie counts par-3 tee shots as approaches and excludes par-4 and par-5 tee shots. The frequently quoted 28/40/17/15 split is a book-derived secondary figure; the spoken interview above is the traceable source for these, and no published table reproduces them exactly.
Two thirds of that gap sits outside 100 yards, which makes break-80 improvement a ball-striking project. His proximity figures give it a size: from 150 yards, a 90-shooter’s median leave is about 56 feet, against 42 feet for an 80-shooter and 23 feet for a professional. Closing 14 feet of median proximity is a swing-skill change measured in seasons, an editorial read rather than a figure Broadie puts a timeline on. Capping a triple at a double is available on the next tee.
Shot Scope’s proximity table shows the same slope across the amateur bands:
| Handicap | From 80 yards | From 100 yards | From 150 yards |
|---|---|---|---|
| 5 | 34 ft | 42 ft | 58 ft |
| 10 | 40 ft | 49 ft | 63 ft |
| 15 | 49 ft | 60 ft | 89 ft |
| 20 | 52 ft | 68 ft | 103 ft |
Source: Shot Scope’s average approach proximity by handicap. These include every lie and every missed green, so they are not comparable to Tour proximity-on-GIR numbers. The category detail is in Strokes Gained: Approach.
The three-column scorecard: find your own leak in three rounds
The published benchmarks tell you what an average 15 handicap does. They cannot tell you which of the three leaks is yours, and the three call for completely different practice weeks. A scorecard already has the answer if you write three more columns on it.
Play three rounds. On every hole, mark:
- P — any penalty stroke, of any kind.
- R — any shot played sideways or backwards because the direct line was gone.
- 3 — any three-putt.
Total each column across the three rounds and divide by three. That gives a per-round rate for each. Then compare against these reference points:
| Column | Audit band, per round | What a number above it points at |
|---|---|---|
| P (penalties) | 1-2 | Tee-shot decisions ahead of tee-shot technique |
| R (recoveries) | 1-2 | Aim and dispersion; the second mistake follows the first |
| 3 (three-putts) | 1.9-3.2 | Speed control beyond 30 feet |
Only the three-putt band is a published per-round average, taken from the Shot Scope and Arccos rates above, and it is wide because the two platforms count differently. The penalty and recovery bands are heuristics rather than measured benchmarks: Stagner’s figure describes the spread between one player’s good and bad rounds, not a population average, and no source publishes a per-round penalty rate by handicap.
The value is in the ranking rather than the absolute numbers. Whichever column is largest relative to its band is the one leak worth four weeks. Most golfers guess wrong about which one it is, because a lost ball is memorable and a lag putt to 8 feet is not.
Course-management claims the data does not support
A few numbers circulate widely in break-90 advice with nothing behind them. They came up repeatedly while researching this post and none resolved to a published dataset:
- “Aiming at tucked pins costs a 15 handicap 0.8 to 1.5 strokes a round.” No published table, sample or model was located.
- “Aiming centre-green saves 3 to 5 strokes a round.” Coaching extrapolation. No controlled amateur trial found.
- “Always aim at the centre.” This oversimplifies DECADE. Scott Fawcett’s own position is that the optimum target sits at an inflection point between flag and centre, adjusted for dispersion and hazard placement.
What is measured is the miss pattern. Inside 150 yards, amateur approaches finish 17.4 percent short-left and 19.0 percent short-right, against 8.0 percent long-left and 6.2 percent long-right — 36.4 percent short against 14.2 percent long. Taking enough club to cover the front edge is supported. A specific stroke saving from doing it is not. More on the decision layer in Golf Course Management Tips.
What the practice research supports
A 2024 systematic review pooled 52 randomised controlled trials of golf motor learning, with a mean effect size of Cohen’s f = 0.50 ± 0.34. The caveat is large: 43 of the 52 studied putting and 41 used novices, so the evidence supports how to structure practice far better than it supports any promise about a handicap.
Three findings survive that caveat well enough to build a protocol on:
- Spread sessions across days. Ninety novices hit 240 putts either in one day or 60 on each of four days. The distributed group retained significantly more at 1, 7 and 28 days. Three 40-minute sessions beat one two-hour session at equal total volume.
- Progress from repetition to variability, in that order. A 60-participant study over 81 trials found a blocked-to-random progression beat both pure blocked and pure random schedules at retention, and beat random at transfer. Going straight to fully random practice is worse than working up to it. The mechanism is covered in Block vs Random Practice.
- Judge improvement on the course. Random practice frequently looks worse during the session and transfers better afterwards, which is why the last ten balls of a range session predict nothing.
On timelines, the honest answer is that no credible population-level study says a typical amateur drops a set number of strokes in a set number of weeks. The clearest data point on record is an Arccos cohort of 14 golfers who went from an average 6.1 Index to scratch in about 26 months and 143 tracked rounds, roughly 2.5 strokes a year — and that group was selected after succeeding, which flatters it considerably.
An 8-week protocol to break 90
- Week 0 — audit three rounds with the three-column scorecard above. Average each column. The largest relative to its band is the only target for the next four weeks.
- Weeks 1-2 — remove the penalty. Choose the tee club for keeping the ball in play on your five widest holes. Keep the driver everywhere else. Log tee shots as in-play or not.
- Weeks 3-4 — speed control from 30 to 50 feet. Two green sessions a week. Three balls each to 30, 40 and 50 feet, scoring anything inside a 3-foot circle. Move to a random distance every ball once you clear 60 percent.
- Weeks 5-6 — chip with less loft. Default to an 8-iron, 9-iron or pitching wedge wherever the ground allows. Practise the landing spot: pick one, land three of five on it.
- Week 7 — play the fat of the green. One round with the flag ignored outside 120 yards. Take the club that covers the front edge. Record greens hit and short-sided chips.
- Week 8 — re-audit. Three rounds, same three columns, compared against Week 0. One fewer event per round across the three columns is roughly two to three strokes.
If nothing moved, rerun the audit rather than the protocol. Repeating practice aimed at the wrong leak is the most common way a season passes without the Index changing — the broader framework is in How to Actually Improve at Golf, and the weekly structure in Golf Practice Plan.
Common mistakes
- Chasing birdies. A 20 Index makes about 1.9 fewer birdies than a scratch golfer but 5.6 more doubles or worse. The bad-hole column is three times the size of the birdie column, and it is the one that responds to decisions.
- Practising putting from 10 feet. Most of the damage starts beyond 32 feet. Short-putt work protects a score; long-putt work creates one.
- Treating fairways hit as the tee-shot metric. Stagner’s best-versus-worst comparison separates rounds by penalties and recoveries, with fairway count differing by less than one.
- Downgrading from driver everywhere. Shot Scope’s par-4 average still favours the driver, 4.81 against 5.11. Reserve the downgrade for holes where a penalty is in range.
- Reaching for the lob wedge around the green. Eight percentage points of up-and-down rate is sitting in the 9-iron.
- Grading practice on the range. Variable practice looks worse in the session and transfers better afterwards. Grade it on the card.
Related reading
- Strokes Gained Explained for Amateurs — the framework that says which category is holding your scores up, with strokes-lost figures by handicap.
- Strokes Gained: Approach Explained — the category that carries 40 percent of the 90-to-80 gap, with proximity data and a practice protocol.
- Golf Handicap Explained — why an 18 Index shoots 90 once every five rounds, and the spread diagnostic behind it.
- Golf Course Management Tips — the decision layer that removes doubles without any swing change.
- Lag Putting Drills — eight calibrated speed-control drills for the range where three-putts start.
- Chipping vs Pitching — the greenside selection gates behind the 8-percentage-point up-and-down finding.
- How to Actually Improve at Golf — the diagnose-then-focus cycle this 8-week protocol is an instance of.
- Golf Practice Plan by Handicap — practice weighting for every Index band, including the 15-to-20 range this post targets.
Key takeaways
- Shot Scope’s per-hole-type averages total 89.5 for a 15 handicap and 94.0 for a 20 on a standard par 72 — the break-90 milestone sits exactly between the two published bands.
- Par 4s carry 2.6 of that 4.56-stroke gap, par 5s 1.28 and par 3s 0.68. Ten holes hold 57 percent of the problem.
- An 89 is 5 pars, 9 bogeys and 4 clean doubles, and Arccos already has the average 15 handicap at 4.2 doubles or worse against 0.5 birdies.
- Severity moves the score as much as frequency. The same 15-handicap distribution totals 88.3 if bad holes average 2 over and 90.4 if they average 2.5 — either side of the milestone on an identical hole count.
- A 20 Index makes 1.9 fewer birdies than scratch but 5.6 more doubles. Scratch golfers play a double-free round 50 percent of the time; a 15 Index, 1.3 percent.
- 83 percent of three-putts start beyond 32 feet, and a 15 handicap’s three-putt leaves 8 feet for the second — both speed problems.
- Chipping with an 8-iron, 9-iron or pitching wedge is worth 8 percentage points of up-and-down rate and 6 feet of proximity over a sand or lob wedge.
- Breaking 80 is a ball-striking project: Broadie puts about 6.5 of those 10 strokes outside 100 yards, with approach alone at 4.0.
Frequently asked questions
What percentage of golfers break 90?
Roughly a quarter, on the best public figure available. Golf Digest’s score distribution puts about 5 percent of golfers scoring in the 70s and 20 percent in the 80s, which taken cumulatively means about 25 percent shoot under 90 and about half break 100. That figure describes how rounds are distributed rather than how many golfers have ever done it once, and it predates the current handicap database, so treat it as a rough population estimate rather than a measured statistic.
What handicap do you need to break 90?
About an 18 Handicap Index to shoot 90 as a good round, and closer to 12 to 15 to break 90 regularly. On a course rated 72.0 with a Slope of 113, a score of 90 produces a Score Differential of exactly 18.0. But the USGA’s own probability table shows a 15.0 to 19.9 player produces a differential at or better than their Index only about once every 5.1 rounds. Breaking 90 most weeks therefore needs an Index several strokes below 18.
How many double bogeys can you make and still break 90?
About four, on a par 72, if the rest of the card is clean. A round of 89 with no birdies works out to 5 pars, 9 bogeys and 4 doubles, because 9 bogeys plus 4 doubles is 17 over. Arccos puts the average 15 handicap at 4.2 doubles or worse per round against 0.5 birdies, so the count is already close. Severity decides the rest: four bad holes averaging exactly 2 over produce 89, while four averaging 2.5 over produce 91.
Is it better to make more birdies or fewer double bogeys?
Fewer doubles, by a wide margin. Lou Stagner’s Arccos analysis found a 20 Index makes about 1.9 fewer birdies per round than a scratch golfer but about 5.6 more double bogeys or worse. The bad-hole column is roughly three times the size of the birdie column. The same data shows a scratch golfer plays a double-free round 50 percent of the time, against 1.3 percent for a 15 Index and 0.2 percent for a 20.
Where do golfers trying to break 90 lose the most strokes?
On par 4s. Shot Scope’s per-hole-type averages put a 20 handicap at 5.31 on par 4s against 5.05 for a 15 handicap. Across ten par 4s that is 2.6 strokes of the 4.5-stroke difference between the two, with par 5s worth 1.28 and par 3s only 0.68. Underneath that, the events driving it are penalty strokes, sideways recovery shots and three-putts rather than any single swing fault.
How long does it take to break 90?
Months rather than weeks for a committed player, and there is no credible study that puts a number on it. The clearest data point on record is an Arccos cohort of 14 golfers who went from an average 6.1 Index to scratch, taking about 26 months and 143 tracked rounds at roughly 2.5 strokes per year. That group was selected after succeeding, so it flatters the timeline. Any promise of a fixed handicap drop in a fixed number of weeks is marketing.
Should I aim at the centre of the green to break 90?
Usually yes from outside 120 yards, though the popular numbers attached to that advice are not sourced. Claims that centre-green targeting saves an amateur 3 to 5 strokes a round trace to no published study. What is measured is the miss pattern: amateurs miss short of the green far more than long, 36.4 percent against 14.2 percent inside 150 yards. Scott Fawcett’s own position is that the optimum sits between flag and centre, adjusted for dispersion.