
Greens in Regulation: What GIR Means and What's Normal by Handicap
A green in regulation is the putting surface in par minus two strokes. Scratch players hit 11 a round, 15-handicaps 4.3, and the gap is mostly distance.

Quick answer
A green in regulation is recorded when the ball rests on the putting surface after par minus two strokes — one on a par 3, two on a par 4, three on a par 5. The fringe does not count. Tracked amateur data puts a scratch player at 61% (about 11 greens), a 10-handicap at 36%, and a 15-handicap at 24% — roughly 4.3 greens a round. The PGA Tour averaged 65.72% in 2025.
Greens in regulation at a glance
| Level | GIR % (Shot Scope) | GIR % (Arccos) | Greens per round |
|---|---|---|---|
| PGA Tour average, 2025 | 65.72% | — | 11.8 |
| Scratch | 61% | 58.1% | 11.0 |
| 5 handicap | 44% | 45.4% | 7.9 |
| 10 handicap | 36% | 34.7% | 6.5 |
| 15 handicap | 24% | 26.0% | 4.3 |
| 20 handicap | 17% | 20.4% | 3.1 |
| 25 handicap | 10% | 16.2% | 1.8 |
Shot Scope figures come from its traditional-statistics report, Arccos figures from benchmarks published by the PGA of America, and the tour row from Today’s Golfer’s summary of the 2025 season. Greens per round is the Shot Scope percentage times 18 holes.
What counts as a green in regulation
The PGA Tour’s definition is the share of holes on which a player reaches the green in regulation, where regulation is par minus two. First stroke on a par 3, second on a par 4, third on a par 5. Any portion of the ball touching the putting surface qualifies, and reaching the green in fewer strokes than that still counts.
Three details trip people up.
The ball has to finish on the green. A shot that lands on the putting surface and releases into the collar is a missed green, regardless of how good it looked in the air.
The fringe is not the green. The USGA’s definition of the putting green excludes the fringe, collar and apron. A ball sitting on the fringe is a miss even when you putt it. This is where the statistic starts lying to you, and it comes up again below.
GIR is a statistical convention with no standing in the Rules. Nothing about it affects your score, your penalties or your handicap. It exists because someone wanted a single trackable number for ball-striking, and it is still the best one you can keep with a pencil.
A related convention: only strokes played from the putting surface count as putts. A putter used from the fringe is a chip in the statistics, which is why putts-per-round can look artificially good for a golfer who misses a lot of greens by a little.
What’s normal: GIR by handicap
Two independent shot-tracking companies have published GIR benchmarks by handicap from very large databases, and they broadly agree.
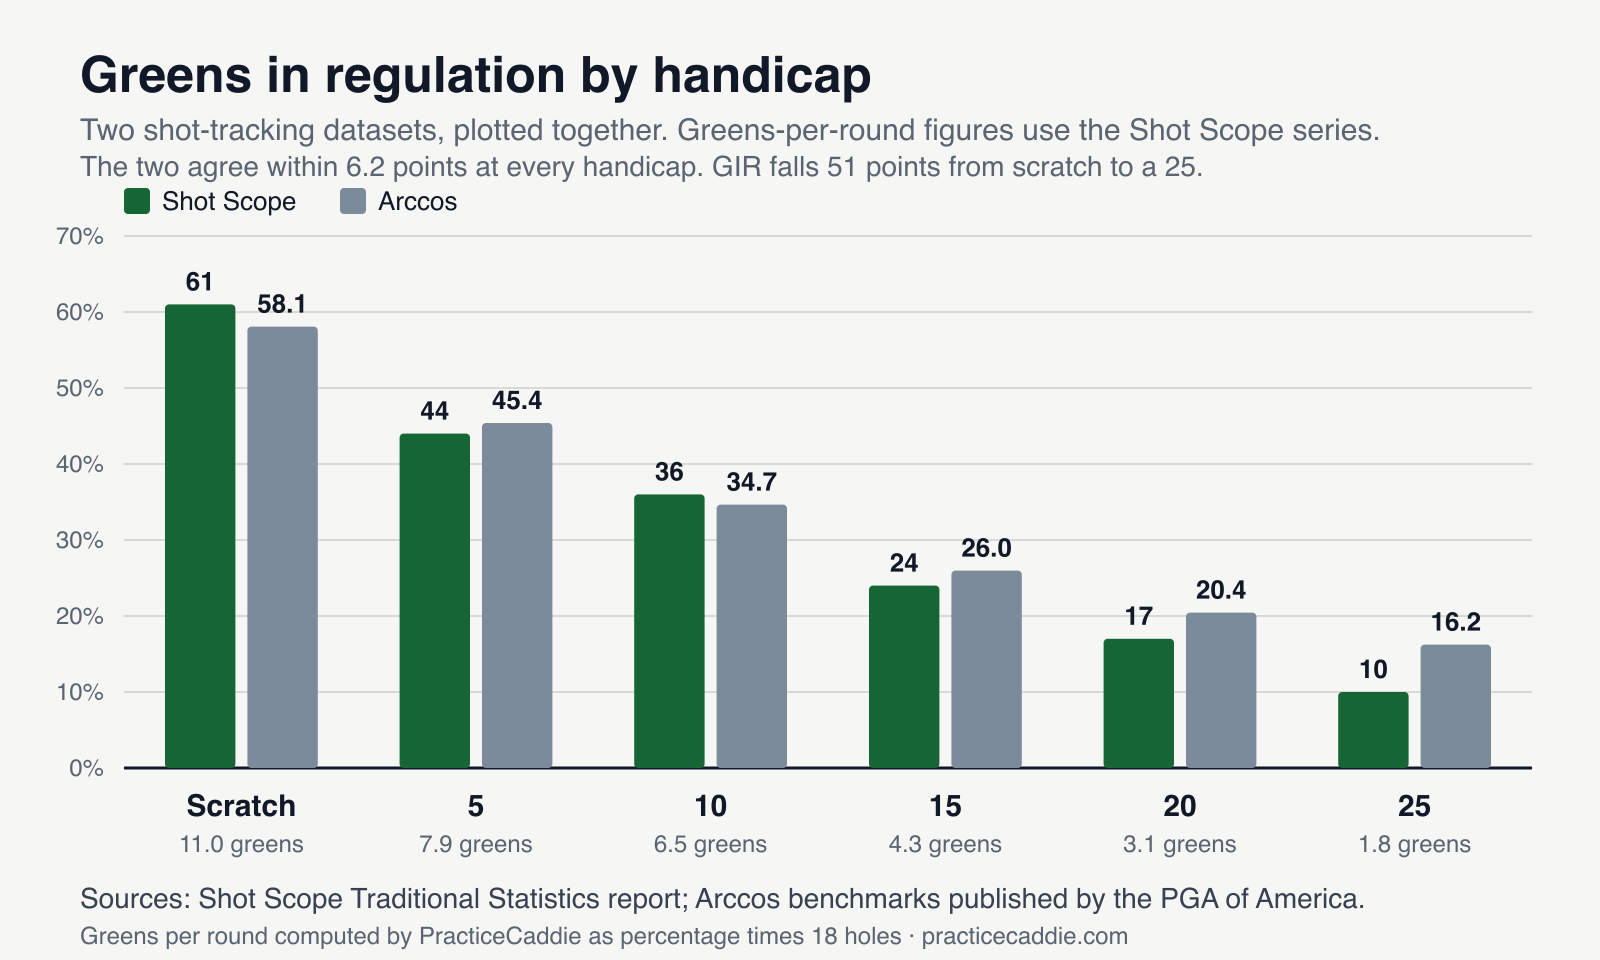
Shot Scope describes its handicap benchmarks as drawn from a database exceeding 350 million tracked shots, and its 2025 annual report covered 870,000 rounds and more than 74 million shots across 124 countries. Arccos passed a billion recorded shots and 20 million rounds in 2024. Neither company states how many of those shots fed the specific handicap table, so treat these as large-sample benchmarks rather than exact population means.
The two series part company at the high-handicap end. Arccos has a 25-handicap at 16.2 percent while Shot Scope has 10 percent — a 6-point gap on a small base. Shot-tracking users skew toward more engaged golfers, and the two platforms attract different mixes, so the honest read is that a 25-handicap hits somewhere between 2 and 3 greens a round.
Fairways, scrambling, up-and-down and putts by handicap
GIR travels with four companion statistics, and the comparison is where it earns its reputation.
| Metric | Scratch | 5 | 10 | 15 | 20 | 25 |
|---|---|---|---|---|---|---|
| Fairways in regulation | 50% | 48% | 49% | 48% | 46% | 46% |
| Greens in regulation | 61% | 44% | 36% | 24% | 17% | 10% |
| Up-and-down rate | 47% | 41% | 31% | 21% | 20% | 18% |
| Putts per round | 29.4 | 30.2 | 31.2 | 33.1 | 33.1 | 33.8 |
All four rows come from the same Shot Scope report, which makes them directly comparable. Fairways in regulation moves 4 percentage points across the entire skill range. Greens in regulation moves 51. Putts per round moves 4.4.
That contrast is the single most useful thing on the page. Driving accuracy barely separates a scratch player from a 25-handicap, because FIR counts a 210-yard poke into the first cut the same as a 290-yard drive in the middle. Approach play separates them completely.
A note on vocabulary, since the words collide: scrambling as a statistic means the share of missed greens where you still made par or better, which is the PGA Tour’s definition. Up-and-down rate is the looser consumer-app version — missed green, holed out in two more, whatever the score. A scramble is also a team format with nothing to do with either, covered separately in golf scramble rules and strategy. A sand save is the same idea from a greenside bunker.
PGA Tour benchmarks
The tour averaged 65.72% in the completed 2025 season and 66.75% in 2024, which is about 12.02 greens per 18 holes. Two things follow from that.
The first is that the best golfers in the world miss a third of the greens they play. The second is that the ceiling is remarkably stable. Golf Compendium’s list of every annual GIR leader since 1980 has a low of 70.34% (Justin Rose, 2012) and a high of 75.15% (Tiger Woods, 2000). Forty-five years of equipment change, agronomy change and course lengthening moved the leading number by 4.81 percentage points.
Season leaders get quoted as tour averages constantly. Rico Hoey led 2025 at 72.15%, Patrick Fishburn led 2024 at 74.21%, and Scottie Scheffler led the 2022–23 season at 74.43% per ShotLink. Every one of those is a leader figure. The 2025 leader sat 6.4 percentage points above the tour average, which is about 1.2 greens a round.
What GIR predicts about your score
More than any other traditional statistic. The clearest expression is Riccio’s Rule, published in INFORMS Analytics Magazine:
Score = 95 − 2 × (greens in regulation per round)
Averaged over four rounds, that prediction landed within one stroke about 90% of the time. It is descriptive rather than causal — adding a green does not mechanically save two strokes — but as a back-of-the-scorecard estimate it holds up well through the middle of the range. Run it against the Shot Scope benchmarks above, on a par-72 course, and a scratch player’s 11.0 greens projects to 73.0 against a tracked 72.8. A 10-handicap’s 6.5 greens projects to 82.0 against a tracked 82.9.
The rule loses accuracy at the high-handicap end. A 20-handicap’s 3.1 greens projects to 88.8, while Shot Scope’s tracked scoring for that band is 21.69 over par, or 93.7. Penalty strokes are the likely reason: the same report has them rising from 0.56 per round at scratch to 3.03 at a 20, and a penalty costs a stroke without ever touching the GIR column. Treat the rule as a good estimator down to about a 15 and a floor beyond it.
The peer-reviewed work agrees on direction. A PGA Tour performance study found GIR the shot-making skill most strongly correlated with scoring average at r = .45, ahead of driving accuracy, which accounted for 19% of scoring-average variance. A separate stepwise regression on tour statistics identified GIR as the most important factor in maintaining a low scoring average, stable across three years.
Shot Scope’s scoring-band data shows the same relationship in tracked amateur rounds, and the steps are even.
| Typical score | Greens per round |
|---|---|
| 100s | 1.8 |
| 90s | 3.6 |
| 80s | 5.4 |
| 70s | 9.0 |
| 60s | 10.8 |
Each ten-stroke band costs about 1.8 greens until the 80s-to-70s transition, which costs 3.6. Breaking 80 is where the approach requirement jumps, which lines up with the practice weighting in how to break 90 in golf.
What actually drives GIR
Three inputs, in order of how much they move the number.
Distance to the flag. Shot Scope’s all-handicap green-hit rates fall from 63.13% at 50–70 yards to 57.80% at 70–90, 52.70% at 90–110, 45.64% at 110–130 and 38.64% at 130–150 yards. Beyond 200 yards the amateur numbers collapse: 14% for a scratch player, 5% for a 5, 2% for a 15 and under 1% for a 25.
Arccos frames the same fact more usefully as a personal threshold — the distance at which you hit half your greens:
| Handicap | 50% GIR distance |
|---|---|
| 5 | 147 yards |
| 10 | 129 yards |
| 15 | 110 yards |
| 20 | 92 yards |
For a 15-handicap, every approach from beyond 110 yards is a coin flip that is losing. That single number reframes layup decisions more than any swing thought.
The lie. GOLFTEC’s tour dataset shows proximity degrading sharply out of the rough: 20 feet from the fairway at 100–125 yards versus 30 feet 3 inches from the rough, and 27 feet 6 inches versus 41 feet 5 inches at 150–175. Arccos puts the amateur version in strokes — an average 10-handicap expects 3.38 strokes from 100 yards in the fairway and 3.50 from the rough.
Tee-shot quality, mostly through distance. One PGA Tour regression found driving distance and accuracy together explained 49.4% of player-to-player GIR variance, with about three extra yards worth as much as two percentage points of accuracy. Arccos golfers in the 0–5 band average 243 yards off the tee and 52% GIR, against 209 yards and 22% GIR for 16–20 handicaps — association rather than proof, since better players are better at everything, but the direction is consistent.
The practical version: your GIR is set by where your approaches start at least as much as by how you swing the iron. Full club-by-club carry numbers sit in the golf club distance chart.
Why approach shots finish short
Across more than six million tracked approaches, Arccos found 40% finished short of the green and only 5% finished long — an eight-to-one bias. Shot Scope’s breakdown by handicap shows the same pattern getting worse as skill drops.
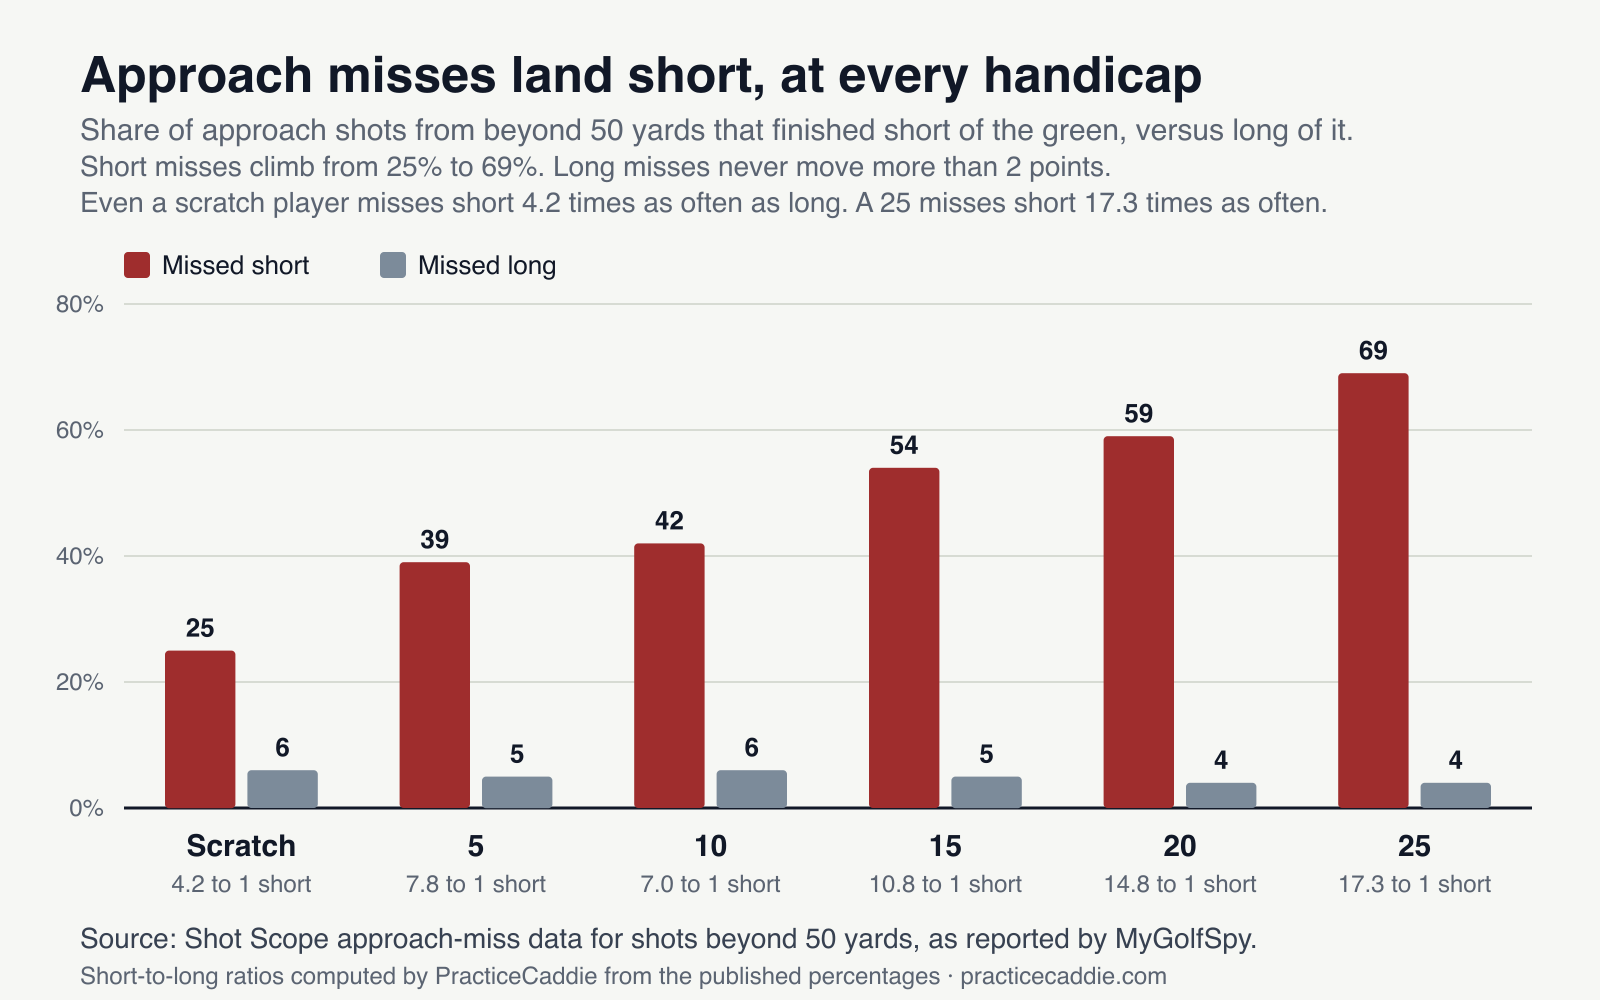
Even a scratch player misses short 4.2 times as often as long. A 25-handicap misses short 17 times as often. The long-miss rate barely moves across the entire skill range, which points the cause at club selection built on a distance chart made of best-ever shots.
The fix costs nothing. Measure your normal carry with each club, using ordinary shots rather than the one you flushed downwind in July, and select for the middle or back of the green rather than the front edge. MyGolfSpy’s write-up of the Shot Scope numbers puts the short-miss rate at 54% for a 15-handicap. Half of all approaches, one club light.
Aiming at the middle helps for the same reason. Even the tour’s short-iron proximity averages sit around 20 feet from 100–125 yards and 23 feet 8 inches from 125–150. Pin-hunting from 150 yards asks for precision that professionals do not have.
The three-question GIR audit
Your GIR number tells you the outcome and nothing about the cause. A 15-handicap hitting 24% could be striking irons well from impossible distances or striking them badly from good ones, and the practice that fixes each is completely different. This is the diagnostic PracticeCaddie uses to separate them, built from the benchmarks above.
Log the start of every approach for three rounds — distance to the flag and lie, about fifteen seconds a hole. That gives about 54 approaches. Then ask three questions.
1. Is your GIR at your handicap’s benchmark? Compare against the table at the top: 61% at scratch, 44% at a 5, 36% at a 10, 24% at a 15, 17% at a 20.
2. How many approaches started inside your 50% line? Use the Arccos thresholds above — 147 yards for a 5, 129 for a 10, 110 for a 15, 92 for a 20.
3. What share of your misses finished short? Sort every missed green into short, long, left, right.
The combination points at one fix.
| Approaches inside the 50% line | GIR vs benchmark | Dominant miss | What is costing you greens |
|---|---|---|---|
| Under a third | At or above | Any | Tee shots and layup targets. Your irons are fine; they never get a chance |
| Over half | Below | Short | Club selection. Build a carry chart from normal shots and take one more |
| Over half | Below | Left or right | Approach quality. Face and path work with the scoring clubs |
| Over half | At or above | Any | Nothing here. Move practice to putting or short game |
The first row is the common one and the least intuitive. A golfer hitting 24% GIR assumes the iron swing is the problem, when the log shows most approaches starting beyond 150 yards. Shot Scope’s all-handicap green-hit rate is already down to 38.64% by 130–150 yards, and a 15-handicap’s own 50% line sits at 110. Shortening the approach by 30 yards moves the number more than a season of range work on 7-irons.
Re-run the audit after six to eight weeks. That cadence matters because GIR is noisy over small samples, which is covered in the caveats below.
Where GIR misleads
Mark Broadie built the strokes-gained framework partly because GIR breaks in ways that matter. His documented example: a player hits 10 of 18 greens and all eight misses stop on the fringe. Raw GIR calls that a poor approach day when the misses were excellent.
Five specific failures:
- The binary boundary. A ball 15 feet away on the fringe is a miss; a ball 60 feet away on the green is a hit. The worse shot scores better.
- Proximity is invisible. An approach to 1 foot and one to 40 feet both earn exactly one GIR, and Broadie has pointed at that gap directly. Their birdie probabilities are nothing alike.
- All misses are equal. Fringe and water both register zero.
- Starting distance is ignored. Reaching the green from 200 yards in rough earns the same credit as from 90 yards in the fairway, so GIR bundles driving, course setup and approach execution into one number.
- Course mix moves it. Longer holes produce longer approaches, so the same player’s GIR falls on a longer course without their approach play changing at all.
The same bias infects putts per round. Golfers who hit more greens start with longer putts, so raw putting statistics partly measure starting distance rather than putting skill — the observation Broadie’s putting research was built on.
Strokes gained repairs all of this by comparing every shot to a benchmark from its actual position and lie, producing fractional credit instead of a binary. The full framework sits in strokes gained explained for amateurs, with the approach category — the one that drives GIR — broken out in strokes gained: approach.
GIR survives all of it as an outcome benchmark, which is exactly how the audit above treats it.
Common mistakes
- Quoting a season leader as the tour average. The 2025 tour average was 65.72%; the leader was 72.15%. The gap is about 1.2 greens per round.
- Counting the fringe. It is a missed green under every standard convention, including your app’s.
- Comparing GIR across courses. A 6,200-yard muni and a 6,900-yard championship layout produce different approach distances for the same player.
- Reading GIR over one round. Eighteen holes is a tiny sample on a binary outcome. Three rounds is the practical floor, and the audit above is built on that.
- Practicing 7-irons to fix a GIR problem caused by tee shots. The audit’s first question exists for this.
- Building a carry chart from best-ever shots. It is the direct cause of the short-miss bias, and it is the cheapest thing on this list to fix.
- Treating GIR as an approach-skill measure. It measures the outcome of driving, position, lie and approach together.
Related reading
- Strokes Gained Explained for Amateurs — the framework that fixes every GIR limitation listed above, with strokes-lost figures by handicap.
- Strokes Gained: Approach Explained — the category that drives GIR, with proximity benchmarks by distance and a practice protocol.
- Golf Club Distance Chart — real carry numbers by club and handicap, the input the short-miss fix depends on.
- Golf Handicap Explained — how the Index is calculated, and why the same GIR produces different scores on different tees.
- How to Hit Irons — the contact work for when the audit points at approach quality rather than distance.
- Golf Course Management Tips — the layup and target decisions that move approach distance without a swing change.
- How to Actually Improve at Golf — the diagnose-then-practice loop the audit plugs into.
- Golf Practice Plan by Handicap — practice weighting for every Index band once you know which leak to attack.
Key takeaways
- A green in regulation is the putting surface in par minus two strokes, and the fringe does not count. Any part of the ball touching the green qualifies.
- Scratch players hit 61% of greens, a 10-handicap 36%, a 15-handicap 24% — 11.0, 6.5 and 4.3 greens per round on Shot Scope’s tracked benchmarks.
- The PGA Tour averaged 65.72% in 2025. No qualified season leader since 1980 has beaten 75.15%, so the best in the world still miss a quarter of their greens.
- GIR is the strongest traditional predictor of score. Riccio’s Rule — score = 95 − 2 × greens per round — lands within about a stroke 90% of the time over four rounds.
- Fairways in regulation moves 4 points from scratch to a 25. GIR moves 51. That contrast is the argument for weighting practice toward approach play.
- Approach distance sets the ceiling. Green-hit rates fall from 63% at 50–70 yards to 39% at 130–150, and a 15-handicap hits half their greens only from inside 110 yards.
- Amateurs miss short 4 to 17 times as often as long, depending on handicap, while the long-miss rate never moves more than 2 points. It is a carry-chart problem.
- Run the three-question audit over three rounds before changing anything, and re-run it every 6 to 8 weeks.
Frequently asked questions
What is a green in regulation in golf?
A green in regulation is recorded when any part of the ball is resting on the putting surface after par minus two strokes. That means the first shot on a par 3, the second on a par 4, and the third on a par 5. Reaching the green in fewer strokes still counts. The PGA Tour tracks it as greens hit divided by holes played, expressed as a percentage, and it is a statistical convention rather than a Rule of Golf.
How many greens in regulation does an average golfer hit?
It depends heavily on handicap. Shot Scope’s tracked benchmarks put a scratch player at 61 percent, roughly 11 greens per round, a 10-handicap at 36 percent or about 6.5 greens, a 15-handicap at 24 percent or about 4.3 greens, and a 20-handicap at 17 percent or about 3 greens. Arccos data tracks within three points from scratch through a 15, then runs higher at the top of the range, putting a 25-handicap at 16 percent against Shot Scope’s 10. A golfer shooting in the 90s averages about 3.6 greens per round.
What is a good greens in regulation percentage?
Good is relative to your handicap and your approach distances. Beating your handicap band’s benchmark is the honest standard: above 61 percent for a scratch player, above 36 percent for a 10, above 24 percent for a 15. For context, the PGA Tour average was 65.72 percent in 2025, and no qualified season leader has ever exceeded 75.15 percent. Missing a third of your greens is normal even at the top of the professional game.
Does the fringe count as a green in regulation?
No. The fringe, collar and apron are not part of the putting green under the USGA’s definition, so a ball sitting entirely on the fringe is a missed green even when the next stroke is played with a putter. If any portion of the ball touches the putting surface, it counts. This binary boundary is the statistic’s biggest weakness: a ball 15 feet away on the fringe scores worse than a ball 60 feet away on the green.
What is the PGA Tour average for greens in regulation?
The PGA Tour averaged 65.72 percent in the completed 2025 season and 66.75 percent in 2024, which works out to about 12 greens per 18 holes. Season leaders sit higher: Rico Hoey led 2025 at 72.15 percent and Patrick Fishburn led 2024 at 74.21 percent. Leader figures are frequently misquoted as tour averages. Across the official stat era since 1980, every qualified leader has landed between 70.34 and 75.15 percent.
How do I hit more greens in regulation?
Shorten the approach and take enough club. Shot Scope’s tracked green-hit rates fall from 63 percent at 50 to 70 yards to 39 percent at 130 to 150 yards, so where the approach starts matters more than the swing that follows. Amateurs miss short far more than long at every handicap, from a 4-to-1 ratio at scratch to 17-to-1 at a 25. Build a carry-distance chart from normal shots rather than best-ever shots, and aim at the middle of the green.
Is greens in regulation a better stat than strokes gained?
Strokes gained is the better metric, and GIR is the best one you can keep with a pencil. GIR treats a 1-foot approach and a 40-foot approach identically, ignores where the shot started and what lie it came from, and scores a fringe miss the same as a ball in water. Mark Broadie’s strokes-gained framework fixes all of that by comparing every shot to a benchmark from its actual position. Use GIR as a quick outcome benchmark and strokes gained for diagnosis.