
Average Golf Club Distances: The Real Chart by Handicap
Shot Scope puts the 10-handicap 7-iron at 161 yards and the 20-handicap at 146. The full chart by handicap, and why your real number is shorter than you think.
Quick answer
Shot Scope’s tracked on-course data puts a 10-handicap at 259 yards with driver and 161 with a 7-iron; a 20-handicap at 225 and 146. Those are total distances, not carry. TrackMan puts PGA Tour driver carry at 282 yards. The number that costs you strokes is the gap between the club you pull and the shot you hit: Arccos measures a 20-handicap’s 7-iron finishing 22 yards short of the distance they selected it from.
The chart at a glance — male amateur totals by handicap
| Club | Scratch | 10 handicap | 20 handicap | 25 handicap |
|---|---|---|---|---|
| Driver | 285 | 259 | 225 | 204 |
| 3-wood | 261 | 227 | 195 | 178 |
| Hybrid | 237 | 214 | 180 | 162 |
| 4-iron | 223 | 199 | 169 | 151 |
| 5-iron | 200 | 187 | 162 | 143 |
| 6-iron | 185 | 171 | 151 | 137 |
| 7-iron | 178 | 161 | 146 | 132 |
| 8-iron | 166 | 150 | 138 | 122 |
| 9-iron | 155 | 140 | 129 | 108 |
| Pitching wedge | 141 | 127 | 108 | 90 |
| Gap wedge | 126 | 110 | 94 | 79 |
| Sand wedge | 105 | 98 | 85 | 80 |
| Lob wedge | 86 | 79 | 78 | 49 |
All figures in yards. Source: Shot Scope’s tracked shot database, reproduced by MyGolfSpy and GolfMagic. These are on-course total distances measured by GPS, not launch-monitor carry. Build a separate carry chart before trusting any of them over water.
Why the carry-versus-total distinction breaks most published charts
Titleist defines the two plainly: carry is the airborne distance to the first bounce, total is carry plus roll. The problem is that the two biggest amateur datasets and the biggest tour dataset measure different things.
Shot Scope and Arccos work by recording the position of each shot and computing the distance to the next one. That produces total distance by construction. TrackMan measures carry directly from launch conditions and ball flight. So a chart that puts “PGA Tour 7-iron: 176” next to “20-handicap 7-iron: 146” is comparing a carry number to a total number, and understating the real gap.
The practical consequence lands on every shot with trouble in front of the green. A 20-handicap whose 7-iron totals 146 yards carries it some unknown amount less, because roll is the part the GPS number silently includes. Pull that club for a 145-yard shot over a front bunker and the ball can finish in the sand having “gone the right distance.” How much less is unknowable from a total-distance chart, which is the entire argument for measuring your own carry.
| Metric | What it means | What to use it for |
|---|---|---|
| Longest | The single longest shot ever recorded with that club | Nothing. It is the number that puts you in bunkers. |
| Average | Mean of every tracked shot, mishits included | Expected on-course outcome, including the bad ones |
| Performance Average (P-Avg) | Shot Scope’s filtered mean, removing roughly the outer 10% of shots (MyGolfSpy) | The closest thing to a realistic stock yardage |
| Carry | Impact to first bounce, launch-monitor measured | Clearing bunkers, water, false fronts, front edges |
| Total | Carry plus bounce and roll | Driver rollout, layups, running the ball through a fairway |
Shot Scope’s own dashboard documentation explains that its Performance Average deliberately excludes both good and bad outliers to estimate what a golfer can expect from a well-struck shot. That is the column worth memorizing.
How far do PGA and LPGA Tour players hit each club?
Tour numbers are useful for one thing: calibrating how far off the amateur reference points are.
| Measurement | PGA Tour | LPGA Tour | Source |
|---|---|---|---|
| Driver carry | 282 | 223 | TrackMan carry parameter |
| Driver total (official, end of 2025) | 302.8 | 259.8 | USGA / R&A 2025 Annual Driving Distance Report |
| 5-iron carry | 199 | 161 | TrackMan-derived tour tables via GolfGaim and Golf Monthly |
| 7-iron carry | 176 | 141 | Same tables |
| 9-iron carry | 152 | 119 | Same tables |
| Pitching wedge carry | 142 | 107 | Same tables |
Two cautions on that table. The 302.8-yard official figure is measured from the tee to where the ball comes to rest on two selected holes per round, whichever surface it finishes on — a different quantity from the 282-yard carry number, and the two should never be subtracted from each other casually. And older TrackMan tour charts circulate widely with PGA driver carry at 275 and 7-iron carry at 172; the 282 and 176 figures are the current ones. TrackMan itself publishes robust tour-wide averages for the full-swing clubs but not for gap, sand, or lob wedges, so any chart claiming a tour sand-wedge average is extrapolating.
The women’s amateur picture is the one most badly served by generic charts. Golf Monthly’s write-up of Shot Scope’s women’s data shows measured 7-iron totals of 160 yards for scratch-or-better players, 141 for 11-to-15 handicaps, and 122 for 26-plus. The commonly published “average woman hits a 7-iron 120 yards” is really the 26-plus-handicap number wearing a sex label instead of a skill label. Arccos’s driving report, built from 6.5 million driver shots across a random sample of 25,000 users, puts the men’s driver average at 225 yards and the women’s at roughly 178.
The gap between the club you pull and the shot you hit
Arccos compared two numbers that ought to be identical: the mean distance from which golfers selected a given club, and the median distance the resulting shot actually travelled. They are not identical, and the gap widens predictably.
| Club and skill | Distance the club was selected from | Median distance the shot travelled | Shortfall | Shortfall as % of the selected distance |
|---|---|---|---|---|
| Scratch, 5-iron | 194 yd | 176 yd | 18 yd | 9% |
| Scratch, 7-iron | 170 yd | 159 yd | 11 yd | 6% |
| 10-hcp, 7-iron | 165 yd | 148 yd | 17 yd | 10% |
| 20-hcp, 7-iron | 162 yd | 140 yd | 22 yd | 14% |
| Scratch, PW | 126 yd | 122 yd | 4 yd | 3% |
| 10-hcp, PW | 119 yd | 114 yd | 5 yd | 4% |
| 20-hcp, PW | 112 yd | 104 yd | 8 yd | 7% |
Raw yardages from Arccos; the percentage column is PracticeCaddie’s arithmetic on those figures.
Running the percentages surfaces a pattern the raw yardages hide, and it holds along both axes of the table. Moving from the wedge to the 7-iron roughly doubles the shortfall at every skill level — 3% to 6% for a scratch player, 4% to 10% for a 10-handicap, 7% to 14% for a 20-handicap. Moving from scratch to a 20-handicap does the same again, in both clubs the data covers: 6% to 14% with the 7-iron, 3% to 7% with the wedge. Club length and handicap look like independent multipliers on one error, though Arccos published only these two clubs at all three skill levels, so treat the pattern as strongly indicated rather than established across the whole bag.
A second, entirely separate dataset points the same direction. Shot Scope’s approach analysis tracks the share of green-seeking approaches from beyond 50 yards that finish short:
| Handicap | Approaches finishing short |
|---|---|
| Scratch | 25% |
| 5 | 39% |
| 10 | 42% |
| 15 | 54% |
| 20 | 59% |
| 25 | 69% |
A 15-handicap misses short on more than half of all approaches. A 25-handicap on more than two thirds. Two independent tracking companies, two different methodologies, one conclusion: the number in your head is longer than the shot in your hands, and the error scales with how long the club is and how high your handicap is.
A stopgap correction, until you measure properly. No source publishes a correction factor, so this is PracticeCaddie’s own rule of thumb read straight off the percentage column above: subtract about 5% from a believed wedge number and about 10% from a believed mid-iron number, and stretch the mid-iron correction to about 14% if you play off 20. It applies only to the wedges and mid-irons Arccos measured — the same correction may or may not hold for long irons and fairway woods, where published data is unavailable. Directionally it lands close to Mark Broadie’s finding that the average 90-shooter’s 150-yard approach pattern centres about 13 yards short of the hole, an error of roughly 9%.
How many yards should be between each club? The gapping audit
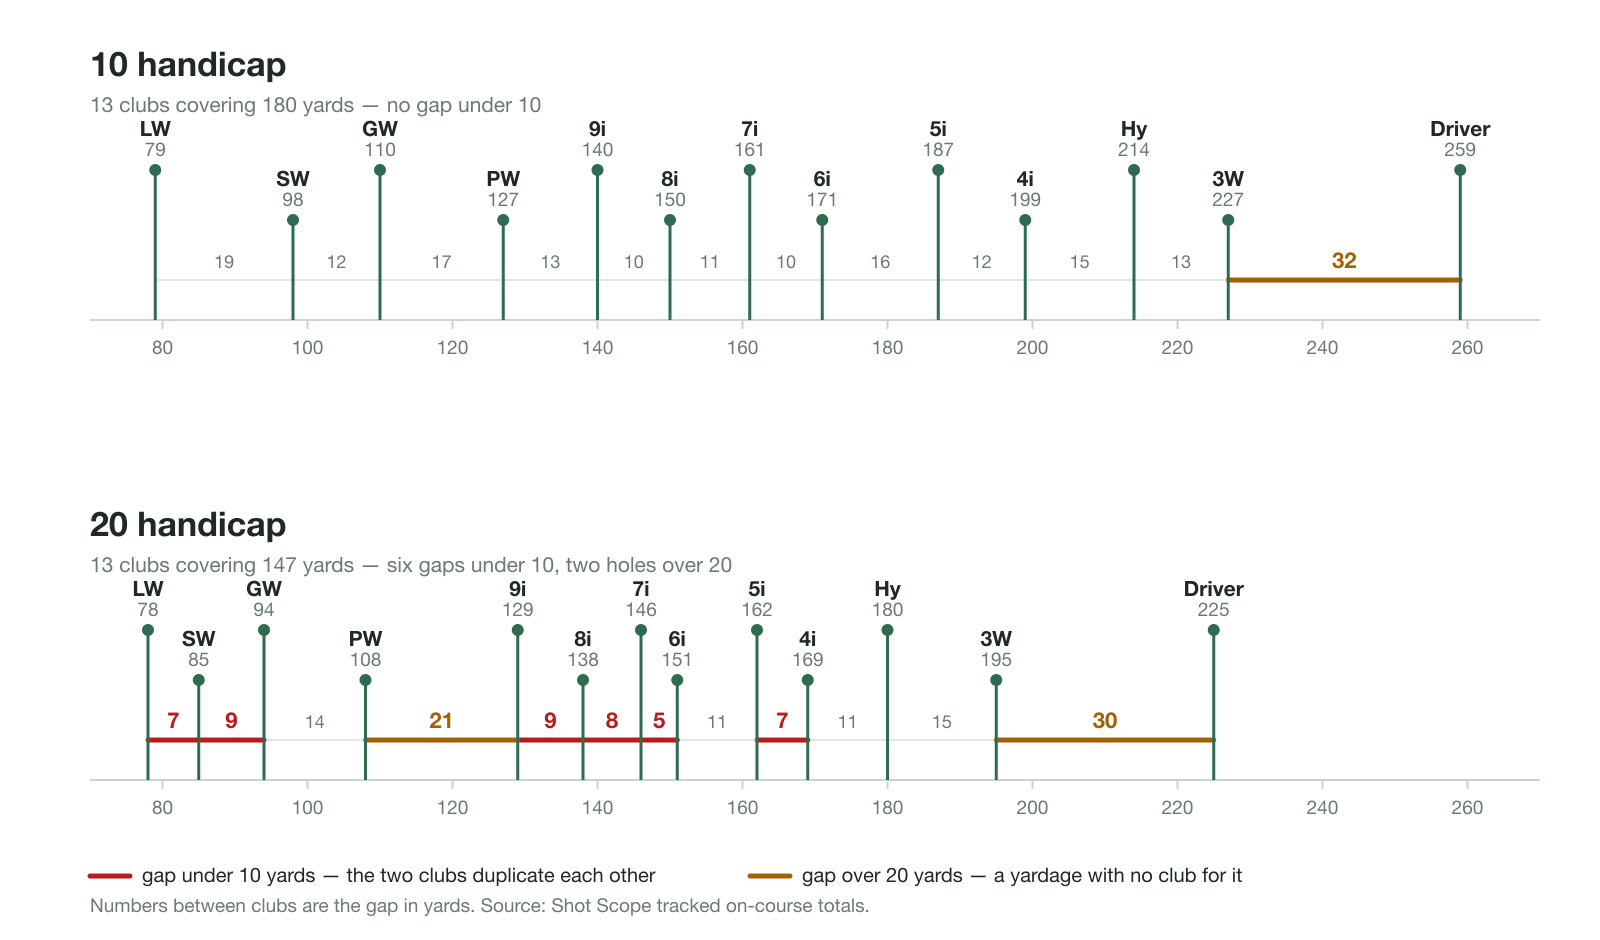
Plot both bags on one scale and the difference stops being about distance at all. The 10-handicap covers 180 yards with 13 clubs and has no gap under 10 yards anywhere in the bag — every step is 10 to 19 yards except the 32-yard jump from 3-wood to driver, which nearly every golfer has. The 20-handicap covers 147 yards with the same 13 clubs and has six gaps under 10 yards (4-iron to 5-iron at 7, 6-iron to 7-iron at 5, 7-iron to 8-iron at 8, 8-iron to 9-iron at 9, gap wedge to sand wedge at 9, sand wedge to lob wedge at 7) alongside two holes over 20 (9-iron to pitching wedge at 21, 3-wood to driver at 30). Six of that player’s clubs are effectively duplicates of the club next to them, and two common yardages have nothing to hit. Those gap figures are arithmetic on the Shot Scope table at the top of this page; the differential is not something either dataset states directly.
MyGolfSpy’s gapping guidance sets the target at 10 to 15 yards of carry between consecutive clubs, and gives the conversion that makes it actionable: roughly one degree of loft equals three yards of carry, so four degrees of loft separation produces about a 12-yard gap. GolfTEC recommends 4 to 6 degrees between wedges on the same arithmetic.
Real amateur bags violate this constantly, and the failures cluster in two places.
The top of the bag compresses as handicap rises. MyGolfSpy’s dedicated fairway-wood chart shows a 10-handicap at 225 with a 3-wood, 203 with a 5-wood, and 190 with a 7-wood — gaps of 22 and 13 yards, a usable ladder. The same three clubs for a 25-handicap read 179, 167, and 163. Four yards separate the 5-wood from the 7-wood. One of those clubs is a passenger.
A caveat on the 3-wood specifically, because it is the one club where Shot Scope’s published figures do not agree with each other. The overall handicap chart used at the top of this page gives a 10-handicap 227 and a 25-handicap 178; the fairway-wood-specific chart gives 225 and 179; and Shot Scope’s driver-versus-3-wood analysis reports a whole-database 3-wood average of 203 against 225 with the driver. The handicap-specific numbers sit one to two yards apart, most likely because the tables were cut from different sample windows with different shot filters. Treat it as a useful reminder that even the best amateur datasets carry a couple of yards of noise. All three versions agree on the finding that matters: the driver is only about 20 to 25 yards longer than the 3-wood, a small concession for a club most golfers hit off the tee believing it is dramatically safer.
The wedges overlap at the bottom. Shot Scope’s 20-handicap totals run PW 108, GW 94, SW 85, LW 78 — gaps of 14, 9, and 7 yards. At 25 handicap the gap wedge sits at 79 and the sand wedge at 80. Two clubs, one yardage. The loft stamped on a wedge guarantees nothing about the distance it produces, because the pitching wedge it needs to gap from has been getting stronger for two decades.
And a single club has an enormous spread. MyGolfSpy’s hybrid chart shows one high-handicap grouping whose 3-hybrid raw average is 132 yards while its filtered Performance Average is 161 — a 29-yard difference produced entirely by how many mishits the filter removes. The 4-hybrid runs 121 against 149. Any golfer quoting a single number for a club they hit twice a round is quoting a coin flip.
The audit itself takes about ten minutes with a completed carry chart. Lay every club on one yardage line and apply two thresholds — PracticeCaddie’s working rule, derived by bracketing MyGolfSpy’s 10-to-15-yard target rather than published anywhere. Any consecutive pair inside 8 yards is a duplicate, and one of them can leave the bag. Any hole wider than 20 yards is a yardage you cannot play, and it usually sits between the driver and the longest fairway club, or between the pitching wedge and the next wedge down. Both are loft problems with loft solutions.
What actually creates the distance
Distance is speed converted at a rate set by strike quality and launch conditions. The conversion rate matters as much as the speed.
TrackMan publishes that 1 mph of added driver clubhead speed is worth up to 3 yards under efficient launch conditions. The USGA’s measurement of actual recreational golfers found a shallower real-world slope: 2.84 yards of driving ability per 1 mph of clubhead speed, and 2.02 yards per 1 mph of ball speed. The difference between the two figures is the efficiency most amateurs are giving away.
TrackMan’s profile of the average male amateur quantifies exactly how much. That golfer swings 93.4 mph, produces 132.6 mph of ball speed, launches at 12.6° with 3,275 rpm of spin, and carries the driver 204 yards. Modelling the same 93.4 mph swing with optimised delivery — 140.1 mph ball speed, 14.7° launch, 2,300 rpm — produces a 228-yard carry. Twenty-four yards, with no added speed.
Smash factor is the shorthand for that efficiency: ball speed divided by club speed, with a driver ceiling near 1.50 and an expected pitching-wedge value near 1.25. There is no single universally optimal launch window, because the optimum moves with speed and attack angle. TrackMan’s driver optimizer table gives a 90 mph player about 191 yards of carry at a −5° attack angle (11.1° launch, 3,690 rpm), about 203 yards at a neutral attack angle (13.4°, 3,090 rpm), and about 214 yards at +5° (16.4°, 2,630 rpm). Same speed, 23 yards of spread, all of it in delivery.
Which is why a distance chart and a swing-speed chart answer different questions. The swing speed chart by age and handicap tells you what your engine produces. This chart tells you what your bag currently does with it.
How to measure your own golf club distances
Four sessions. The order matters, because measuring tired or measuring total-when-you-need-carry both produce a chart that is worse than no chart.
1. Warm up, then measure carry with a launch monitor
Hit 15 shots before recording anything. FlightScope’s gapping guidance recommends roughly 10 shots per club for a full session and explicitly warns against starting with the first swings of the day. Use the ball you actually play — range balls vary too much in construction and age to give a correction factor worth applying. Record carry.
If ten shots per club across fourteen clubs is more than a session allows, Golf Digest’s shorter protocol accepts 3 to 5 shots per club, on the condition that the sample contains normal shots rather than only the ones that felt good.
2. Trim both ends, then average
Throw out genuine anomalies: shanks, tops, duffs. Keep ordinary thin and toe strikes — those are part of your distribution whether you like them or not. Then, from ten remaining shots, drop the longest and the shortest and average the middle eight.
Discarding only the worst shot is the common version of this advice and it is quietly wrong. It removes one tail and keeps the other, which inflates every yardage in the bag by several yards and reintroduces the exact short bias the exercise exists to eliminate.
3. Record the spread alongside the average
Write down three numbers per club, not one:
- Stock carry — the trimmed mean from step 2.
- Expected window — the shortest and longest of the middle eight. This is the number that decides whether a front pin over water is a green light.
- Total range — collected on the course, in step 4.
The expected window is the number golfers routinely skip, and it is what separates a chart from a wish. A 7-iron whose stock carry is 150 but whose window runs 138 to 158 is a very different club from one whose window runs 146 to 154, and only one of them can be aimed at a tucked pin.
4. Collect total distance on the course
Carry comes off a launch monitor; total comes off the golf course, where turf firmness and slope get a vote. Use a GPS tracker across five rounds. Arccos requires at least 20 recorded shots with a club before generating its smart range, and filters over as many as 30 — a reasonable minimum for any method.
Then re-measure at least once a season, and immediately after changing shafts, lofts, ball model, or making a swing change that alters strike. MyGolfSpy’s gapping guide makes the same point: a chart built on last season’s strike quality quietly reintroduces the error it was built to remove.
How altitude, temperature, and ball condition change your distances
Once the chart exists, four environmental factors are worth adjusting for and several are not.
| Factor | Effect | Worked example | Source |
|---|---|---|---|
| Altitude | About 1.16% per 1,000 ft (elevation in feet × 0.00116) | A 250-yard sea-level drive carries roughly 265 yards at 5,000 ft | Titleist aerodynamics |
| Temperature | 1 to 2 yards per 10°F, scaling with shot length | A nominal 250-yard driver measured 242 yd at 35°F, 250 at 75°F, 254 at 95°F | Golf.com / Andrew Rice TrackMan test; Golf Digest citing TrackMan |
| Wet ball or face | Carry and spin both collapse | A 110-yard sand wedge carried 103 yd wet, with spin at 7,162 rpm against 10,430 dry | Golf.com / Cameron McCormick TrackMan test |
| Cover damage | Direction suffers more than distance, until the damage is severe | A lightly scuffed ball flew 8+ yards offline; a moderately scuffed one lost 40+ yards of carry and finished 45+ yards offline | MyGolfSpy ball-damage lab test |
| Humidity | Under one yard on a 6-iron across a 10% to 90% swing — ignore it | — | TrackMan modelling summarised by Practical Golf |
The altitude figure is worth flagging because a rounder “2% per 1,000 feet” rule circulates widely and overstates the effect by most of a club at Denver elevation. Titleist’s aerodynamic model gives about 5.8% at 5,000 feet, not 10%.
The temperature range is wide because the effect scales with how long the shot is. TrackMan’s general rule of thumb, as reported by Golf Digest, is about a yard per 10°F; the specific 250-yard driver test measures two. Both figures are correct for the shot each was measured on. Use 1 yard per 10°F for wedges and 2 for the driver.
When a distance chart is the wrong project
Measuring the bag is high value for a golfer whose strike is repeatable enough that a stock number means something. For a golfer whose 7-iron genuinely ranges from 110 to 165 depending on contact, the chart will be honest and useless — the expected window will be wider than the gaps between clubs, and no club selection can survive it.
That golfer’s leverage point is strike quality, not yardage bookkeeping. The ball-striking drills post and how to hit irons are the right reads, and the chart becomes worth building once the window tightens to something narrower than 15 yards.
The same holds for anyone whose real scoring problem is off the tee rather than into greens. Strokes Gained analysis exists to answer that question before you spend four sessions on a measurement project, and course management is where a finished chart eventually gets spent.
Build the gapping session into a real plan
A gapping session is the rare piece of golf work with a defined end state: fourteen clubs, three numbers each, a printed card in the bag. The failure mode is that it never gets scheduled, because it competes with hitting drivers.
Related reading
- Strokes Gained Explained for Amateurs — the pillar for every data-driven decision on this site. Read it first if you are not sure whether approach distance is actually your leak.
- Strokes Gained: Approach Explained — the proximity data behind the short-miss pattern, and the practice protocol that tightens it.
- Golf Swing Speed Chart by Age and Handicap — the companion benchmark post. Speed is the input; this chart is the output.
- How to Hit Irons — compression and low-point control, which is what makes a stock number reproducible in the first place.
- How to Hit a Hybrid and How to Hit a Fairway Wood — the two clubs whose gaps collapse first as handicap rises.
- How to Hit a Driver — the launch-condition work behind the 24 yards TrackMan found in the average amateur’s existing swing speed.
- Golf Handicap Explained — how the handicap bands in every table above are actually calculated.
- Golf Course Management Tips — where a finished distance chart turns into strokes.
- Practice plan by handicap — the long-form guide to weighting practice time once you know which end of the bag is broken.
Key takeaways
- A 10-handicap averages 259 yards with driver and 161 with a 7-iron; a 20-handicap 225 and 146, per Shot Scope’s tracked database. Both are total distances, not carry.
- PGA Tour driver carry is 282 yards and LPGA 223 per TrackMan; official total driving distance is 302.8 and 259.8 per the USGA and R&A’s 2025 report. Carry and total are different measurements and must not be compared.
- The club-selection shortfall roughly doubles along both axes — wedge to mid-iron, and scratch to 20-handicap. Arccos data puts a 20-handicap’s 7-iron 22 yards (14%) short of the distance it was selected from, against 4 yards (3%) for a scratch player’s wedge.
- Shot Scope confirms it independently: 42% of a 10-handicap’s approaches and 59% of a 20-handicap’s finish short of the green.
- Target 10 to 15 yards of carry between clubs, using the conversion that one degree of loft is worth about three yards (MyGolfSpy). A 25-handicap’s 5-wood and 7-wood are typically 4 yards apart.
- Gap quality separates the handicaps more sharply than distance does. Running the arithmetic on Shot Scope’s table, a 10-handicap has no gap under 10 yards anywhere in the bag; a 20-handicap has six, plus two holes over 20 yards.
- The average male amateur leaves 24 yards on the table at their current speed — 204 yards of driver carry against 228 with optimised launch and spin at the same 93.4 mph, per TrackMan.
- Measure ten shots per club, then drop the longest and the shortest and average the middle eight. Discarding only the worst shot inflates every number in the bag.
- Adjust 1.16% per 1,000 feet of elevation and 1 to 2 yards per 10°F. Ignore humidity; replace scuffed balls, which cost direction long before they cost distance.
Frequently asked questions
What is the average distance for each golf club?
For a 10-handicap male amateur, Shot Scope’s tracked on-course totals are roughly 259 yards with driver, 227 with a 3-wood, 214 with a hybrid, 187 with a 5-iron, 161 with a 7-iron, 140 with a 9-iron, and 127 with a pitching wedge. A 20-handicap runs about 225, 195, 180, 162, 146, 129, and 108 for the same clubs. These are total distances measured by GPS on the course, not launch-monitor carry numbers, so they include bounce and roll.
How far does the average golfer hit a 7-iron?
It depends almost entirely on handicap. Shot Scope’s tracked data puts a scratch male amateur at 178 yards total with a 7-iron, a 10-handicap at 161, a 20-handicap at 146, and a 25-handicap at 132. That is a 46-yard spread across the amateur range. For women, Shot Scope’s measured 7-iron totals run from 160 yards for scratch-or-better players down to 141 for an 11-to-15 handicap and 122 for 26-plus.
What is the difference between carry distance and total distance?
Carry is the airborne distance from impact to the first bounce. Total is carry plus bounce and roll. A launch monitor like TrackMan measures carry directly; a GPS tracker like Shot Scope or Arccos measures the distance between two shot locations, which is total. Most published amateur charts are total distances, and most published tour charts are carry, so the two get compared incorrectly all the time. Use carry for anything that must clear a bunker, a hazard, or a front edge.
How far do PGA Tour players hit each club?
TrackMan puts PGA Tour average driver carry at 282 yards and LPGA Tour average driver carry at 223 yards. TrackMan-derived tour tables show PGA averages of about 199 yards carry with a 5-iron, 176 with a 7-iron, 152 with a 9-iron, and 142 with a pitching wedge. Official total driving distance is a different measurement: the USGA and R&A recorded 302.8 yards for the PGA Tour and 259.8 for the LPGA Tour at the end of the 2025 season.
Why do I always come up short on approach shots?
Because golfers pick clubs for their best strike rather than their median one. Arccos compared the distance golfers select a club from against the distance the shot actually travels: a scratch player’s 7-iron falls 11 yards short of the selected number, a 10-handicap 17 yards, and a 20-handicap 22 yards. Shot Scope’s tracking agrees, showing that 42% of a 10-handicap’s approaches and 59% of a 20-handicap’s finish short of the green.
How many yards should be between each golf club?
MyGolfSpy’s gapping guidance is 10 to 15 yards of carry between consecutive clubs, and roughly one degree of loft equals three yards of carry, so four degrees produces about a 12-yard gap. GolfTEC recommends 4 to 6 degrees between wedges for the same reason. Amateur bags routinely violate this: Shot Scope data shows a 25-handicap’s 5-wood and 7-wood separated by only 4 yards, and the same player’s gap and sand wedges effectively overlapping.
How much does altitude and temperature change golf club distances?
Titleist’s aerodynamic model estimates a distance increase of about 1.16% per 1,000 feet of elevation, so a 250-yard drive at sea level travels roughly 265 yards at 5,000 feet. Temperature effects run between 1 and 2 yards per 10 degrees Fahrenheit depending on club and shot length. A TrackMan test of a nominal 250-yard driver measured 242 yards at 35°F, 250 at 75°F, and 254 at 95°F. Humidity changes carry by less than a yard.