
Launch Monitor Numbers Explained: Smash Factor, Spin Loft, and Attack Angle
TrackMan's own optimizer says +5 degrees of attack angle is worth 25 yards at 100 mph, and only 8 of them come from ball speed. Every number decoded.

Quick answer
A launch monitor reports two kinds of number: outcome (ball speed, carry, launch angle) and cause (attack angle, spin loft, face-to-path). Smash factor is ball speed divided by club speed, and 1.50 is the driver ceiling. Spin loft — dynamic loft minus attack angle — is the number that explains smash factor and spin rate at the same time. Watch one outcome number and one causal number per session, and treat everything else as background.
The seven numbers at a glance
| Number | What it is | Tour benchmark (driver) | What it tells you |
|---|---|---|---|
| Club speed | Clubhead speed just before impact | 115 mph PGA / 96 LPGA | Your distance ceiling |
| Ball speed | Ball speed just after impact | 171 mph PGA / 143 LPGA | How much of that ceiling you reached |
| Smash factor | Ball speed ÷ club speed | 1.49 PGA and LPGA | Strike efficiency |
| Attack angle | Up or down direction of the clubhead at impact | −0.9° PGA / +2.8° LPGA | Whether you are adding or paying loft |
| Dynamic loft | Loft the face presents at impact | 13.8° PGA (derived) | Launch, with attack angle |
| Spin loft | Dynamic loft − attack angle | 14.7° PGA / 15.0° LPGA | Spin and smash factor together |
| Spin rate | Backspin in rpm immediately after launch | 2,545 PGA / 2,506 LPGA | Whether the ball climbs, holds, or falls out |
Every figure above comes from TrackMan’s published parameter pages: club speed, ball speed, smash factor, attack angle, spin loft and spin rate. Dynamic loft is the one derived cell: 14.7° spin loft plus a −0.9° attack angle gives 13.8°.
Why a launch monitor session usually teaches nothing
The screen shows sixteen values after every swing, all of them true, none of them ranked. So the golfer reads the one that moved most, chases it for six shots, and leaves with a slightly different swing and no record of what changed.
The fix is boring and it works: one outcome number, one causal number, ten shots of baseline before you touch anything. That structure is the whole point of the session protocol lower down this page. It also matches how the on-course data works — Strokes Gained is useful because it ranks your leaks, and a launch monitor is useful for the same reason or not at all.
Smash factor: how much of your speed reached the ball
Smash factor is ball speed divided by club speed. Swing at 100 mph, produce 145 mph of ball speed, and your smash factor is 1.45.
TrackMan’s guidance is short: “A golfer would hope to achieve a Smash Factor near 1.50 on driver shots”, and a pitching wedge should sit near 1.25. Loft drives that drop. Present more of it and a smaller share of your club speed reaches the ball.
Why 1.50 is the driver ceiling
The Rules cap the spring effect of a clubface, and the conforming limit is conventionally quoted as a coefficient of restitution of 0.83 — a standard the R&A and USGA equipment rules enforce through a pendulum test. Run the one-dimensional collision equation with that value, a roughly 200 g driver head and a 45.9 g ball, and you land at about 1.49.
The equation is looser than its reputation. Its limiting ratio, as clubhead mass approaches infinity, is 1 + 0.83 = 1.83. Real club mass, loft, spin and ball deformation are what pull the figure down to 1.50, which makes it a practical ceiling for a conforming driver rather than a mathematical wall. A reading of 1.52 on a range unit is far more likely to be a measurement artifact than an illegal club.
Smash factor by handicap
| Segment (male, driver) | Club speed | Ball speed | Smash factor | Attack angle | Spin rate |
|---|---|---|---|---|---|
| PGA Tour | 115 mph | 171 mph | 1.49 | −0.9° | 2,545 rpm |
| LPGA Tour | 96 mph | 143 mph | 1.49 | +2.8° | 2,506 rpm |
| Scratch or better | 110 mph | 161 mph | 1.49 | −0.9° | 2,896 rpm |
| 5 handicap | 101 mph | 147 mph | 1.45 | −1.1° | 2,987 rpm |
| 10 handicap | 95 mph | 138 mph | 1.45 | −1.2° | 3,192 rpm |
| Average golfer (14.5) | 94 mph | 133 mph | 1.44 | −1.8° | 3,275 rpm |
| Bogey golfer | 92 mph | 131 mph | 1.43 | −2.1° | 3,127 rpm |
One caveat worth knowing before you do arithmetic on that table. Each column is averaged independently across a population, so dividing the ball-speed column by the club-speed column will not always reproduce the smash column — 161 ÷ 110 gives 1.46, while TrackMan publishes 1.49 for that segment. The average of a set of ratios is not the ratio of the averages. Read each column against your own equivalent, and never against the neighbouring cell.
The gap that matters in that table is small and expensive. A 10 handicap at 95 mph and a scratch player at 110 mph differ by 15 mph of club speed, which is a training problem covered in how to increase golf swing speed. They also differ by 0.04 of smash factor, which is worth roughly 4 mph of ball speed at 95 mph — free yards available without swinging harder. For the full speed picture by age and handicap, see the golf swing speed chart.
Spin loft: the number behind smash factor and spin at once
Spin loft is the angle between the direction the clubhead is travelling and the direction the face is pointing. TrackMan’s working approximation is dynamic loft minus attack angle, accurate whenever face-to-path is small.
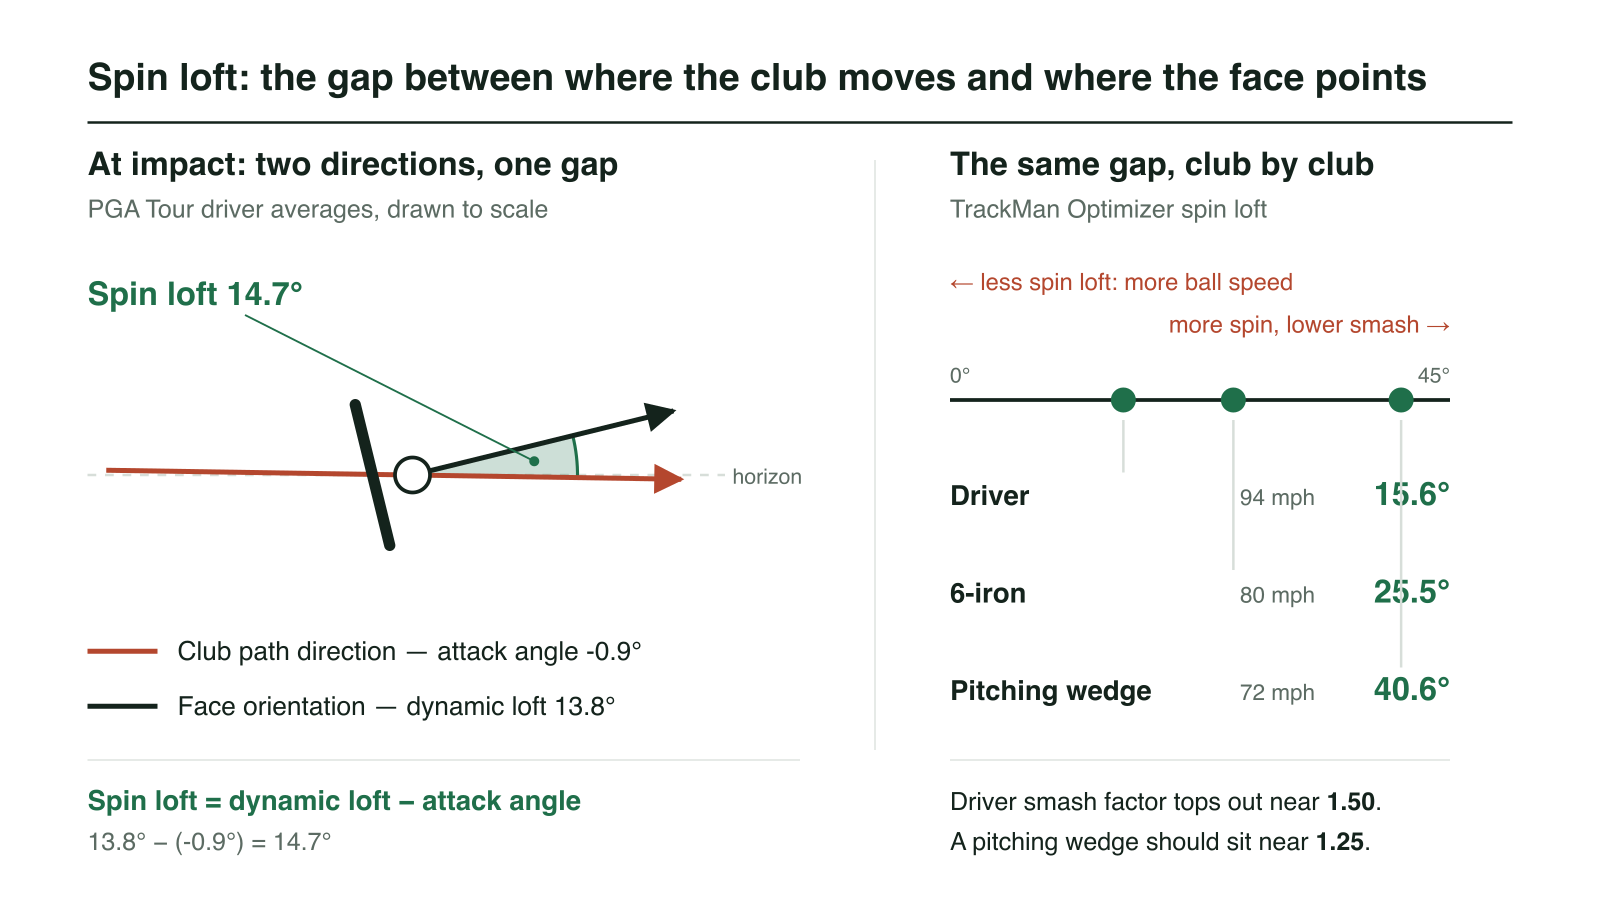
Two consequences follow from TrackMan’s own spin loft page, and they run in opposite directions:
- A higher spin loft produces a higher spin rate. More oblique contact spends more of the collision on rotation.
- A higher spin loft produces a lower smash factor. The same energy that went into spin did not go into forward ball speed.
That is why smash factor slides steadily from 1.50 down to 1.25 as you go from driver to wedge, and why comparing your 7-iron smash factor to your driver’s tells you nothing. TrackMan’s Optimizer puts a 94 mph driver at 15.6° of spin loft, an 80 mph 6-iron at 25.5°, and a 72 mph pitching wedge at 40.6°.
It also puts a number on “compression”. A ball-first strike with forward shaft lean lowers dynamic loft, which lowers spin loft, which raises smash — the mechanism laid out in how to compress the golf ball. Run the same logic backwards and you get backspin on a wedge, where high spin loft becomes the goal.
Attack angle: where 25 yards comes from
Attack angle is the up-or-down direction the clubhead is travelling at impact. Negative means the club is still descending, positive means it is already climbing. Off the turf it is normally negative; off a tee it has room to go the other way.
TrackMan’s driver fitting chart models optimized carry across attack angles at a fixed clubhead speed. Swapping a −5° attack angle for a +5° one, with loft optimized for each, produces this:
| Club speed | Carry at −5° | Carry at +5° | Gain |
|---|---|---|---|
| 75 mph | 143 yd | 164 yd | +21 yd |
| 90 mph | 191 yd | 214 yd | +23 yd |
| 100 mph | 222 yd | 247 yd | +25 yd |
| 110 mph | 252 yd | 279 yd | +27 yd |
The popular version of this — “hitting up adds 25 to 30 yards” — is fair from about 100 mph and overstates it below that.
Splitting the 25 yards
Almost nothing written about attack angle bothers to decompose that gain, and the decomposition changes what you should practise. Take the two 100 mph rows from that same chart, each carrying the driver loft the chart optimizes for it:
- At −5°: dynamic loft 12.2°, ball speed 144 mph, launch 9.6°, spin 3,722 rpm, carry 222 yd.
- At +5°: dynamic loft 16.7°, ball speed 148 mph, launch 14.9°, spin 2,538 rpm, carry 247 yd.
Ball speed moved 4 mph. How much is 4 mph worth? The same chart gives a rough gauge: hold attack angle at −5° and raise club speed from 100 to 105 mph, and ball speed goes 144 → 152 while carry goes 222 → 237. That is 15 yards for 8 mph, or about 1.9 yards per mph.
On that gauge, extra ball speed accounts for something like 8 of the 25 yards, and the remaining 17 or so come from launching 5.3° higher with 1,184 fewer rpm — trajectory rather than power. Treat the split as an approximation. Every row in the chart is a separately optimized package, so loft moves along with attack angle and nothing is held perfectly still.
The mechanism behind it survives that caveat, because it is the diagram above. Spin loft is dynamic loft minus attack angle: 12.2° − (−5°) = 17.2° on the descending row, and 16.7° − 5° = 11.7° on the ascending one. Spin loft fell 5.5°, and both of TrackMan’s predictions land in the chart’s own numbers — spin dropped 1,184 rpm, and smash factor rose from 144 ÷ 100 = 1.44 to 148 ÷ 100 = 1.48. That 0.04 is the same efficiency gap the handicap table shows between a 10 handicap and a scratch player.
Two honest limits. TrackMan says plainly that a positive attack angle “does not guarantee maximum distance” — driver loft has to suit it, or you simply launch too high. And the chart is a 2010 model of optimized conditions, so read the yardages as the shape of the effect and expect your own bag to differ. The setup changes that produce a positive attack angle are covered in how to hit a driver.
Launch angle and spin rate: read them as a pair
Neither number means anything alone. A 15° launch is excellent at 90 mph and a ballooning miss at 115. True Spec Golf’s preferred parameters, published by GOLF.com, pair them by speed band:
| Driver speed | Preferred launch | Preferred spin | Peak height | Descent angle |
|---|---|---|---|---|
| Under 72 mph | 14–19° | 2,600–2,900 rpm | 45–58 ft | 27–31° |
| 72–83 mph | 14–19° | 2,600–2,900 rpm | 58–70 ft | 31–35° |
| 84–96 mph | 13–16° | 2,400–2,700 rpm | 70–86 ft | 32–36° |
| 97–104 mph | 12–16° | 2,000–2,500 rpm | 87–100 ft | 33–37° |
| 105 mph+ | 10–16° | 1,750–2,300 rpm | 100–120 ft | 34–38° |
Set the average male amateur against that table and the leak is obvious. TrackMan measures him at 94 mph with 3,275 rpm; the band wants 2,400 to 2,700. He is 600 to 900 rpm high, which costs carry at the top of the flight.
Chasing the lowest possible spin is its own mistake. Below roughly 90 mph the ball needs spin to generate lift, and very low spin magnifies the damage from an off-centre strike. Target the band for your speed and stop there.
Iron spin runs far higher by design, and a modern strong-lofted 7-iron will spin hundreds of rpm less than a traditional one at the same swing speed — which is why a spin figure means nothing without the loft next to it. If your clubs are gapping oddly, the golf club distance chart is the place to start before you blame the swing.
Face-to-path: what decides where the ball starts
Face angle dominates starting direction. The commonly taught split is roughly 85% face and 15% path with a driver, and about 75% face with a mid-iron, assuming reasonably centred contact — the figures the PGA Academy publishes from its TrackMan work.
Treat those as a rule of thumb with a real spread. Some TrackMan teaching material quotes closer to 80% for the driver, and the true split shifts with loft, friction, strike location and speed.
Curvature comes from the relationship between the two. TrackMan’s face-to-path page puts it directly: the ball curves toward the face angle and away from the club path. Face open to path for a right-hander tilts the spin axis into a fade; face closed to path tilts it into a draw. Gear effect from a toe or heel strike can override this on a driver, so a wild curve with a sane face-to-path number usually means you missed the middle. The full model, and what it means for a fix, is in golf ball flight laws and applied in how to fix a slice.
What your launch monitor measures, and what it guesses
This is the distinction that decides whether a number deserves a swing change. Radar (Doppler) units track the ball and club in flight; photometric units photograph the ball leaving the face. Neither watches your ball land indoors — carry is always a model, computed from measured launch conditions plus atmospheric assumptions.
Manufacturers publish this if you read closely. Garmin specifies the Approach R10 to ±3 mph club speed, ±1 mph ball speed and ±1° launch angle, with spin, face angle and path derived rather than directly observed. Rapsodo’s MLM2PRO only reports spin rate and spin axis when you use its RPT-marked balls. Bushnell’s Launch Pro measures ball speed, launch angles and spin optically, and MyGolfSpy’s accuracy testing put its indoor deviation at 0.36% on ball speed, 2.82% (92.3 rpm) on backspin and 0.23% (0.2 yards) on carry.
The trust tiers
Sort every number on your screen into one of these four before you act on it.
| Tier | Numbers | How to use them |
|---|---|---|
| Trust the value | Ball speed; club speed on radar; launch angle | Safe to compare session to session and to benchmark tables |
| Trust the trend | Carry, apex, descent angle, launch direction | Watch the direction of change, not the absolute yardage |
| Verify first | Spin rate and spin axis | Optical measurement or marked balls only; otherwise inferred |
| Do not rebuild on | Face angle, club path, face-to-path, attack angle, dynamic loft | Confirm with a coach or strike tape before changing mechanics |
That last row is the expensive one. A budget radar unit’s attack angle is an inference, and rebuilding your driver swing around an inferred degree and a half is how a good swing becomes a project. Impact tape costs a few dollars and settles the strike-location question with more authority than any sub-$700 device.
What the research says about feedback
The evidence for launch monitors as a learning tool is thinner than the marketing suggests. Barzyk and Gruber’s 2024 systematic review in Frontiers in Sports and Active Living pooled 52 randomized controlled trials in golf motor learning and found that no single augmented-feedback method came out consistently ahead. The review also flagged that more than half the included trials lacked statistical power, which is the honest read on most claims in this space.
What the review did support, with clearer evidence: an external attentional focus (think about the ball flight, not your wrists), increasing contextual interference (mixing clubs and targets instead of raking twenty balls with one), and errorless learning with medium to large effect sizes. The contextual-interference finding is the same one behind block versus random practice.
The practical translation: a launch monitor helps when it delivers one interpretable number you can act on, and stops helping when reading the screen becomes the skill you are practising.
The two-number session
- Record a 10-shot baseline before changing anything. All ten lines, one club. Report the median and the spread — one flushed drive describes nothing.
- Pick one outcome number and one causal number. Outcome: ball speed, carry, launch. Cause: attack angle, spin loft, face-to-path. Two numbers total.
- Practise in short blocks, then randomize. Eight to twelve shots so cause and effect stay visible, then switch clubs and targets. Diagnosis is blocked; learning is random.
- Turn the screen off and test retention. Ten shots where you call the result before you look. Getting worse without feedback means the screen was doing the work.
Re-baseline every six to eight weeks. Anything more often is noise; anything less and you cannot tell training from drift. The structure for the surrounding session is in the driving range practice plan.
Common mistakes reading launch monitor numbers
- Comparing smash factor across clubs. A 1.32 seven-iron and a 1.49 driver can come from the same quality of strike. Spin loft is what differs.
- Reading your best shot instead of your median. The screen keeps a running best, which is the least representative number in the session.
- Chasing minimum spin. Below about 90 mph, stripping spin costs carry and punishes off-centre hits harder.
- Acting on an inferred number. Attack angle from a budget radar unit is a calculation dressed up as a reading.
- Comparing indoor carry to outdoor carry. Indoor carry is modeled from launch conditions; altitude, temperature and normalization settings all move it.
- Changing two things at once. With sixteen numbers on screen the temptation is constant, and it makes every result uninterpretable.
Key takeaways
- Smash factor is ball speed ÷ club speed, and 1.50 is the driver ceiling — 1.49 on both the PGA and LPGA Tours, 1.44 for the average 14.5-handicap male.
- Spin loft is the master number. Dynamic loft minus attack angle explains spin rate and smash factor simultaneously: 14.7° for a Tour driver, 40.6° for an optimized pitching wedge.
- The −5° to +5° swap is worth 21 to 27 yards, and roughly two-thirds of that comes from trajectory — only about 8 of the 25 yards at 100 mph trace to extra ball speed.
- The ascending package carries 0.04 more smash factor at identical club speed, because its spin loft falls from 17.2° to 11.7° — the same efficiency gap between a 10 handicap and a scratch player.
- The average amateur spins the driver 600 to 900 rpm too much — 3,275 rpm at 94 mph, against a 2,400 to 2,700 target band.
- Ball speed is the number to trust; spin is the number to verify. Carry is always a model, and face, path and attack angle on budget units are inferences.
- A review of 52 randomized trials found no feedback method consistently superior. One outcome number, one causal number, and a retention test beat a screen full of values.
Frequently asked questions
What is a good smash factor?
For a driver, near 1.50 is the practical ceiling and TrackMan lists 1.49 as both the PGA Tour and LPGA Tour average. Male amateurs run lower: 1.49 for scratch or better, 1.45 at a 5 and a 10 handicap, 1.44 for the average 14.5 handicap, and 1.43 for a bogey golfer. Smash factor falls as loft rises, so a pitching wedge sitting near 1.25 is a healthy number for that club.
Why can’t smash factor go above 1.50?
The Rules cap how much spring a clubface may have, and the conforming limit is usually quoted as a coefficient of restitution of 0.83. Feed that into the collision equation with a 200 gram driver head and a 45.9 gram ball and you get about 1.49. Real club mass, loft and spin are what produce that ceiling; the 0.83 figure on its own would permit a good deal more. Occasional readings just above 1.50 usually come down to a measurement quirk.
What is spin loft in golf?
Spin loft is the angle between the direction the clubhead is moving and the direction the face is pointing at impact. TrackMan’s working approximation is dynamic loft minus attack angle, which is accurate when face-to-path is small. It is the single number that explains smash factor and spin rate together: a wider spin loft means more spin and a lower smash factor, while a tighter one sends a bigger share of your club speed into the ball. PGA Tour drivers average 14.7 degrees.
Should I hit up on my driver?
For most players, yes, though the gain depends on speed. TrackMan’s carry optimizer shows a golfer at 100 mph carrying 222 yards with a minus 5 degree attack angle and 247 yards with a plus 5, a 25-yard difference at identical clubhead speed. The same swap is worth 21 yards at 75 mph and 27 at 110 mph. A positive attack angle only helps if your driver loft suits it, and PGA Tour players average minus 0.9 degrees while LPGA players average plus 2.8.
Which launch monitor numbers can I trust?
Ball speed is the safest reading on almost any properly aligned unit, and club speed is reliable on radar. Carry, apex and descent angle are modeled from launch conditions rather than watched to the ground, so treat them as trends. Spin varies most between units: photometric monitors read it optically, while radar units without marked balls infer it. Face angle, club path, attack angle and dynamic loft are the numbers least worth rebuilding a swing around on a budget device.
How many rpm should my driver spin?
True Spec Golf’s preferred parameters put an 84 to 96 mph driver swing at 2,400 to 2,700 rpm, a 97 to 104 mph swing at 2,000 to 2,500 rpm, and 105 mph and above at 1,750 to 2,300 rpm. The average male amateur measures 3,275 rpm at 94 mph, which is several hundred rpm high. Slower swings need spin to hold the ball up, so chasing the lowest possible number costs carry below roughly 90 mph.
Do launch monitors actually make you better?
The evidence is thinner than the marketing. Barzyk and Gruber’s 2024 systematic review of 52 randomized controlled trials in golf found no single augmented-feedback method consistently superior, and noted that more than half the trials lacked statistical power. What the review did support is an external attentional focus and higher contextual interference. A launch monitor helps when it supplies one interpretable number per session, and stops helping when the screen becomes the skill.
Related reading
- Strokes Gained Explained for Amateurs — the pillar for the measurement side of the game, and the framework that decides which launch-monitor number is worth your practice time.
- How to Compress the Golf Ball — spin loft applied to iron strike, with the shaft-lean and low-point work that raises smash factor.
- Golf Swing Speed Chart by Age and Handicap — where your club speed sits against the benchmarks, before you chase efficiency.
- How to Hit a Driver — the setup changes that turn a negative attack angle positive.
- Golf Ball Flight Laws Explained — the face-and-path model behind every curve your monitor reports.
- Block vs Random Practice — the contextual-interference research behind the block-then-randomize session structure above.
- Average Golf Club Distances — what your carry numbers should look like once the strike is sorted, by handicap.